


京卫计网审[2015]第0523号 京ICP备14051922号 京ICP证160408号
京公网安备 11010502030806号 Copyright © 2014 北京易康医疗科技有限公司版权
全国免费咨询热线
400-627-0012
发布时间:2016-06-17 | 来源: | 责任编辑:嗵嗵e研
今天跟大家一起讨论一下用R软件如何制作逻辑回归的列线图。
制作步骤:
1、安装rms程序包。
首先你需要选择安装镜像,最近我们发现China(Xiamen)这个镜像速度还比较快。安装代码为:install.packages("rms")
2、调用rms过程。
代码为require(rms)
3、生成回归所需数据,本文采用R的示例数据。
代码如下:
n <- 1000 set.seed(17) age <- rnorm(n, 50, 10)blood.pressure <- rnorm(n, 120, 15)cholesterol <- rnorm(n, 200, 25)sex <- factor(sample(c('female','male'), n,TRUE))# Specify population model for log odds that Y=1L <- .4*(sex=='male') + .045*(age-50) + (log(cholesterol -10)-5.2)*(-2*(sex=='female') + 2*(sex=='male'))# Simulate binary y to have Prob(y=1) = 1/[1+exp(-L)]y <- ifelse(runif(n) < plogis(L), 1, 0)
4、制作列线图。
代码如下: ddist <- datadist(age,blood.pressure, cholesterol, sex) options(datadist='ddist') f <- lrm(y ~ age+ blood.pressure+ cholesterol + sex) nom <- nomogram(f, fun=plogis, fun.at=c(.001,.01, .05, seq(.1,.9, by=.1), .95, .99, .999),lp=F, funlabel="最后的发病风险") plot(nom)
5、结果如下:
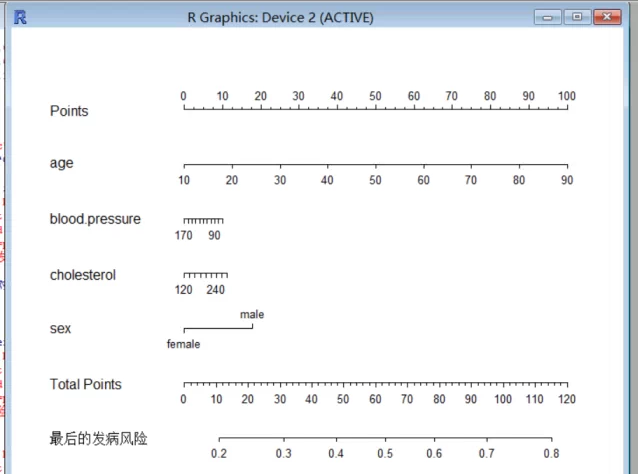
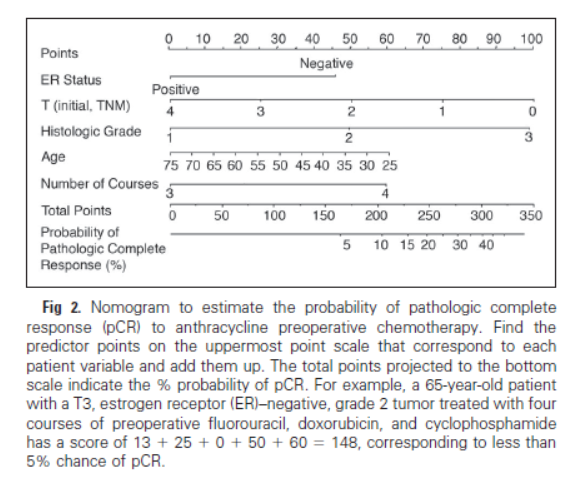
在经过了上述的过程之后,我们就可以做出列线图了。但是如果我们要写作一篇关于列线图的文章该如何进行呢?我们可以看看别人是怎么做的,这个例子是乳腺癌术前化疗对病理完全缓解(PCR)和无转移生存(MFS)的影响,详见参考文献。
作者写作内容有:
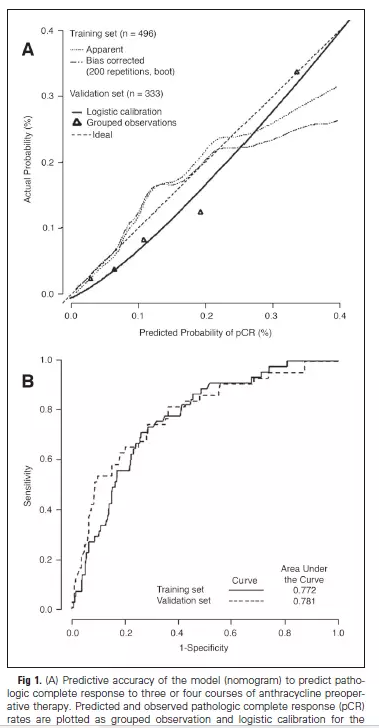
(1)将样本按照不同来源(来自不同的机构)分成了训练样本和验证样本,
(2)用训练样本去建立回归模型,
(3)用验证样本并判断模型的优劣,
(4)制作列线图,
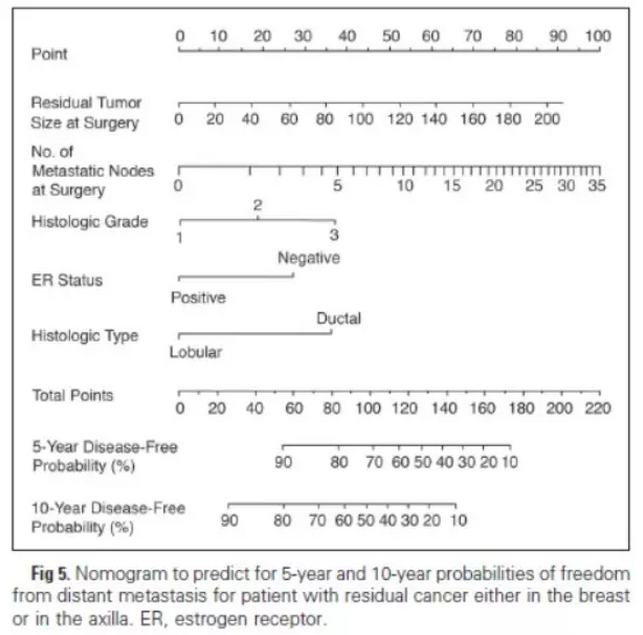
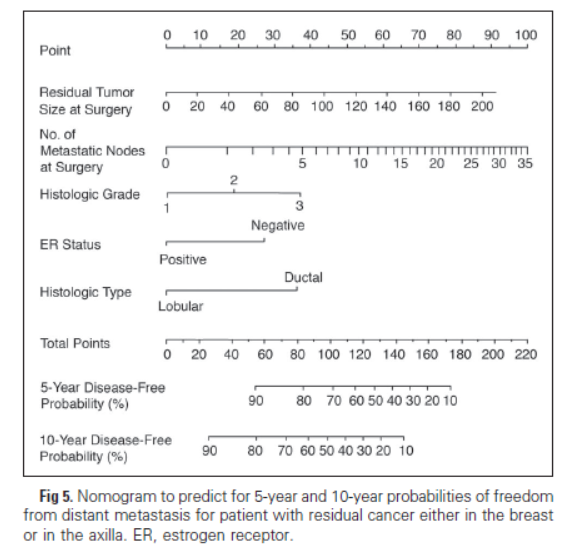
(5)同时作者还制作了5年和10年disease-free的列线图。
文章中涉及的图形如下:
参考文献:
Rouzier R, Pusztai L, Delaloge S, Gonzalez-Angulo AM, Andre F, Hess KR, et al. Nomograms to predict pathologic complete response and metastasis-free survival after preoperative chemotherapy for breast cancer. J Clin Oncol. 2005 2005-11-20;23(33):8331-9.

京卫计网审[2015]第0523号 京ICP备14051922号 京ICP证160408号
京公网安备 11010502030806号 Copyright © 2014 北京易康医疗科技有限公司版权